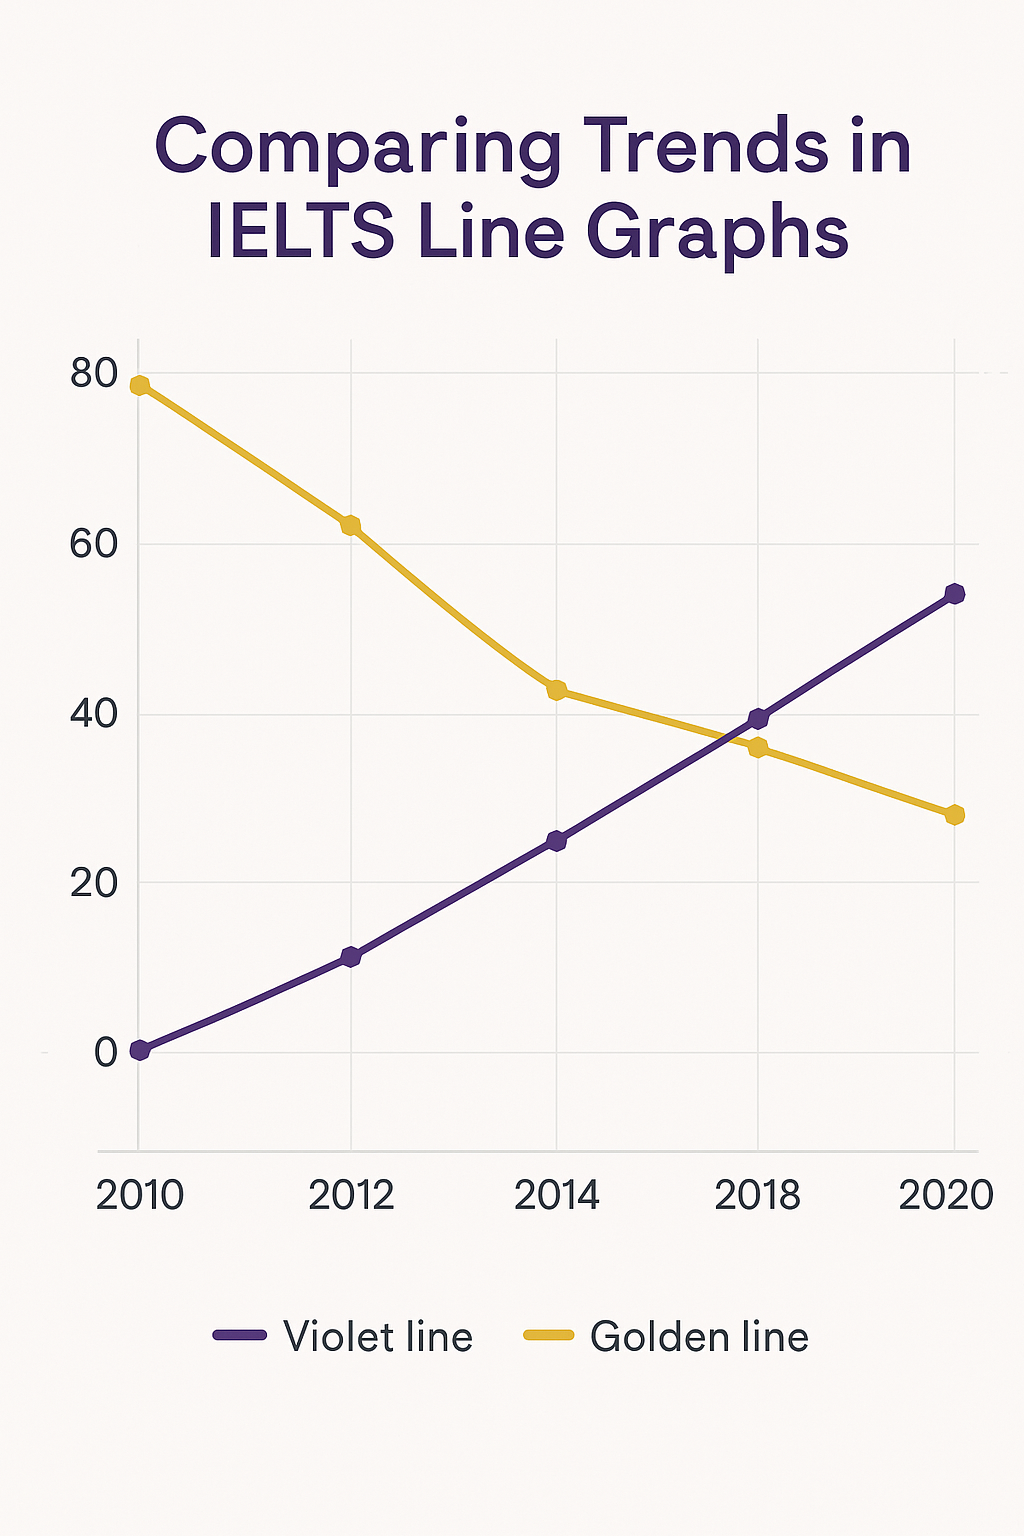
An IELTS line graph is a visual chart that shows data changes over a time period.
In Writing Task 1, candidates analyze, describe, and compare statistics to produce a formal report.
Success depends on clear trend analysis, accurate vocabulary, and a logical, coherent structure.
A well-organized answer highlights main patterns, interprets performance data, and presents comparisons in concise paragraphs to meet the assessment criteria for grammar, cohesion, and clarity.
What is an IELTS line graph in Writing Task 1?
An IELTS line graph depicts trends over time using an axis to present data points. The exam task requires candidates to summarize key features, assess fluctuations, and compare patterns. Reports should highlight the most significant changes without unnecessary detail. This type of chart is common in IELTS Writing task 1 because it tests analytical skills and the ability to explain statistical information effectively.
How to structure an IELTS line graph answer
A structured approach improves both clarity and band score. The recommended structure:
- Introduction – Present the chart, the axis, and the time period. Paraphrase the question without copying exact words.
- Overview – Summarize the most important trend, fluctuation, or static pattern without specific numbers.
- Body Paragraph 1 – Analyze increasing or decreasing data and describe notable trends.
- Body Paragraph 2 – Compare multiple lines, identify differences, and assess progressive or fluctuating patterns.
| Section | Purpose | Key Actions |
| Introduction | Introduce data source and time period | illustrate, depict |
| Overview | Summarize main patterns | highlight, identify |
| Body 1 | Describe detailed trends | analyze, describe, explain |
| Body 2 | Compare lines and features | compare, evaluate, assess, summarize |
Vocabulary for describing trends in IELTS line graphs
Precise vocabulary improves accuracy and helps meet assessment standards:
- Increasing: rise, grow, climb, improve
- Decreasing: fall, drop, decline, reduce
- Fluctuating: vary, oscillate, shift, change
- Static: remain constant, stay stable
Example: Between 2000 and 2010, candidate performance steadily increased, then fluctuated before reaching a static point.
How to compare trends effectively
When comparing trends in line graph, candidates should:
- Match similar time periods for fair analysis
- Highlight the largest and smallest changes
- Present statistics in a logical, consistent sequence
- Use formal linking phrases: while, whereas, in contrast

Common mistakes in describing line graphs
- Misinterpreting the chart’s axis or scale
- Adding irrelevant details instead of focusing on main trends
- Using informal language in a formal exam report
- Writing paragraphs without logical progression
Advanced grammar for IELTS line graph writing
Which tense to use
- Past simple – when data is fully in the past
- Present perfect – when the trend continues to the present
- Future forms – for projected statistics
Example: Statistics have shown a progressive improvement since 2010.
Sentence structure tips
- Place subjects like the chart or candidates before verbs
- Use strong verbs: analyze, highlight, assess, explain
- Apply comparison forms and precise adjectives for accuracy
Complex grammar forms for high scores
- While-clause: While scores increased, fluctuations remained minimal.
- Relative clause: The data, which depicts performance over two decades, shows consistent improvement.
- Passive voice: Statistics were presented to illustrate candidate performance.
Practice strategies to improve IELTS line graph answers
- Practice with past IELTS Writing Task 1 questions
- Summarize trends within 20 minutes for time management
- Evaluate model answers for strengths and weaknesses
- Organize key points before writing for coherence
FAQ – IELTS Line Graph Writing
Q1: How to write IELTS Task 1 for a line graph?
Identify the main trends, summarize them in an overview, then describe details in two structured paragraphs.
Q2: What vocabulary should I use to describe a line graph?
Use accurate trend words like rise, decline, fluctuate, and remain stable.
Q3: How to compare trends effectively in IELTS writing?
Highlight similarities and differences, using formal connectors and clear statistical references.
Q4: What are common mistakes in describing line graphs?
Avoid irrelevant details, incorrect tense usage, and informal tone.
Q5: How to get a band 9 in IELTS Task 1?
Maintain accuracy, use a formal style, ensure coherence, and provide clear comparisons supported by accurate grammar.
Conclusion
An IELTS line graph task tests a candidate’s ability to interpret statistics, highlight patterns, and present data in a structured, formal report.
Success depends on accurate vocabulary, logical organization, and precise grammar.
Regular practice with real exam questions, combined with clear trend analysis and proper paragraph structure, significantly improves performance and increases the chance of achieving a higher band score.

